Readable, Colorful Data: Empowering Insight and Discovery

Passion with Visualizing Complex Data

Accordion Arrow

Design + Coding in Data Visualization

Data visualization has been a foundational passion that led me into digital and product design. I’ve built and refined my skills in coded visualizations using frameworks like Processing, D3, and openFrameworks, allowing me to blend design with code to transform complex data into intuitive, accessible formats. This combination has been invaluable in enhancing decision-making tools across business intelligence and market analysis.

In my recent role at a B2B market intelligence platform, I developed diverse data visualization strategies to communicate corporate insights, such as financial and partnership dynamics, through interactive and highly usable formats. Previously, at Dow Jones, I contributed to early-phase market data visualizations for key indexes, tailored for the Wall Street Journal’s mobile app.

Takuma Kakehi
Visualizing public opinions by surfacing context behind data
In 1824, The Harrisburg Pennsylvanian, a newspaper from a town in Pennsylvania conducted the first known public opinion polls in history, and successfully predicted ...

Edge - B2B emerging industry intelligence

Accordion Arrow

Edge by Uzabase is a competitive analysis tool designed to help corporate business development teams gain a clear understanding of client and competitor strategies through detailed data visualizations. This feature provides an enterprise-focused view of partnership and investment activities, allowing users to analyze trends and identify competitors directly on enterprise pages.

To develop this tool, I led discovery sessions with clients to identify key user needs, ultimately reimagining the data display from an enterprise perspective rather than an industry-wide view. The resulting wireframes and UI emphasized usability, facilitating side-by-side comparisons between enterprises to support strategic decision-making.

2022 - Current
Uzabase (EDGE)
B2B Intelligence Platform
  • Trend Tracking Dashboard: Trend-tracking system analyzing key activities like early funding rounds, partnerships, and product launches to identify emerging technologies. The system includes early indicators of technological trends and will expand with broader datasets and enhanced customization post-beta release.
  • Partnership visualization: Custom color-coded visualization representing corporate partnership, investment, and product development strategies. The visualization includes an interactive competitive comparison tool as well as timeline view for enhanced analysis.
  • Network Diagram: Transformed from the partnership visualization, this network graph serves to identify common partnership strategies among multiple companies and assess relationship intensities. The prototype was developed using the D3 framework.
Enterprise Activity Tracker Competitor Analysis Tool
The use of libraries, such as D3, is helpful for quickly sketching a data visualization to test.

PLEY - Data Visualization Mockup

Accordion Arrow

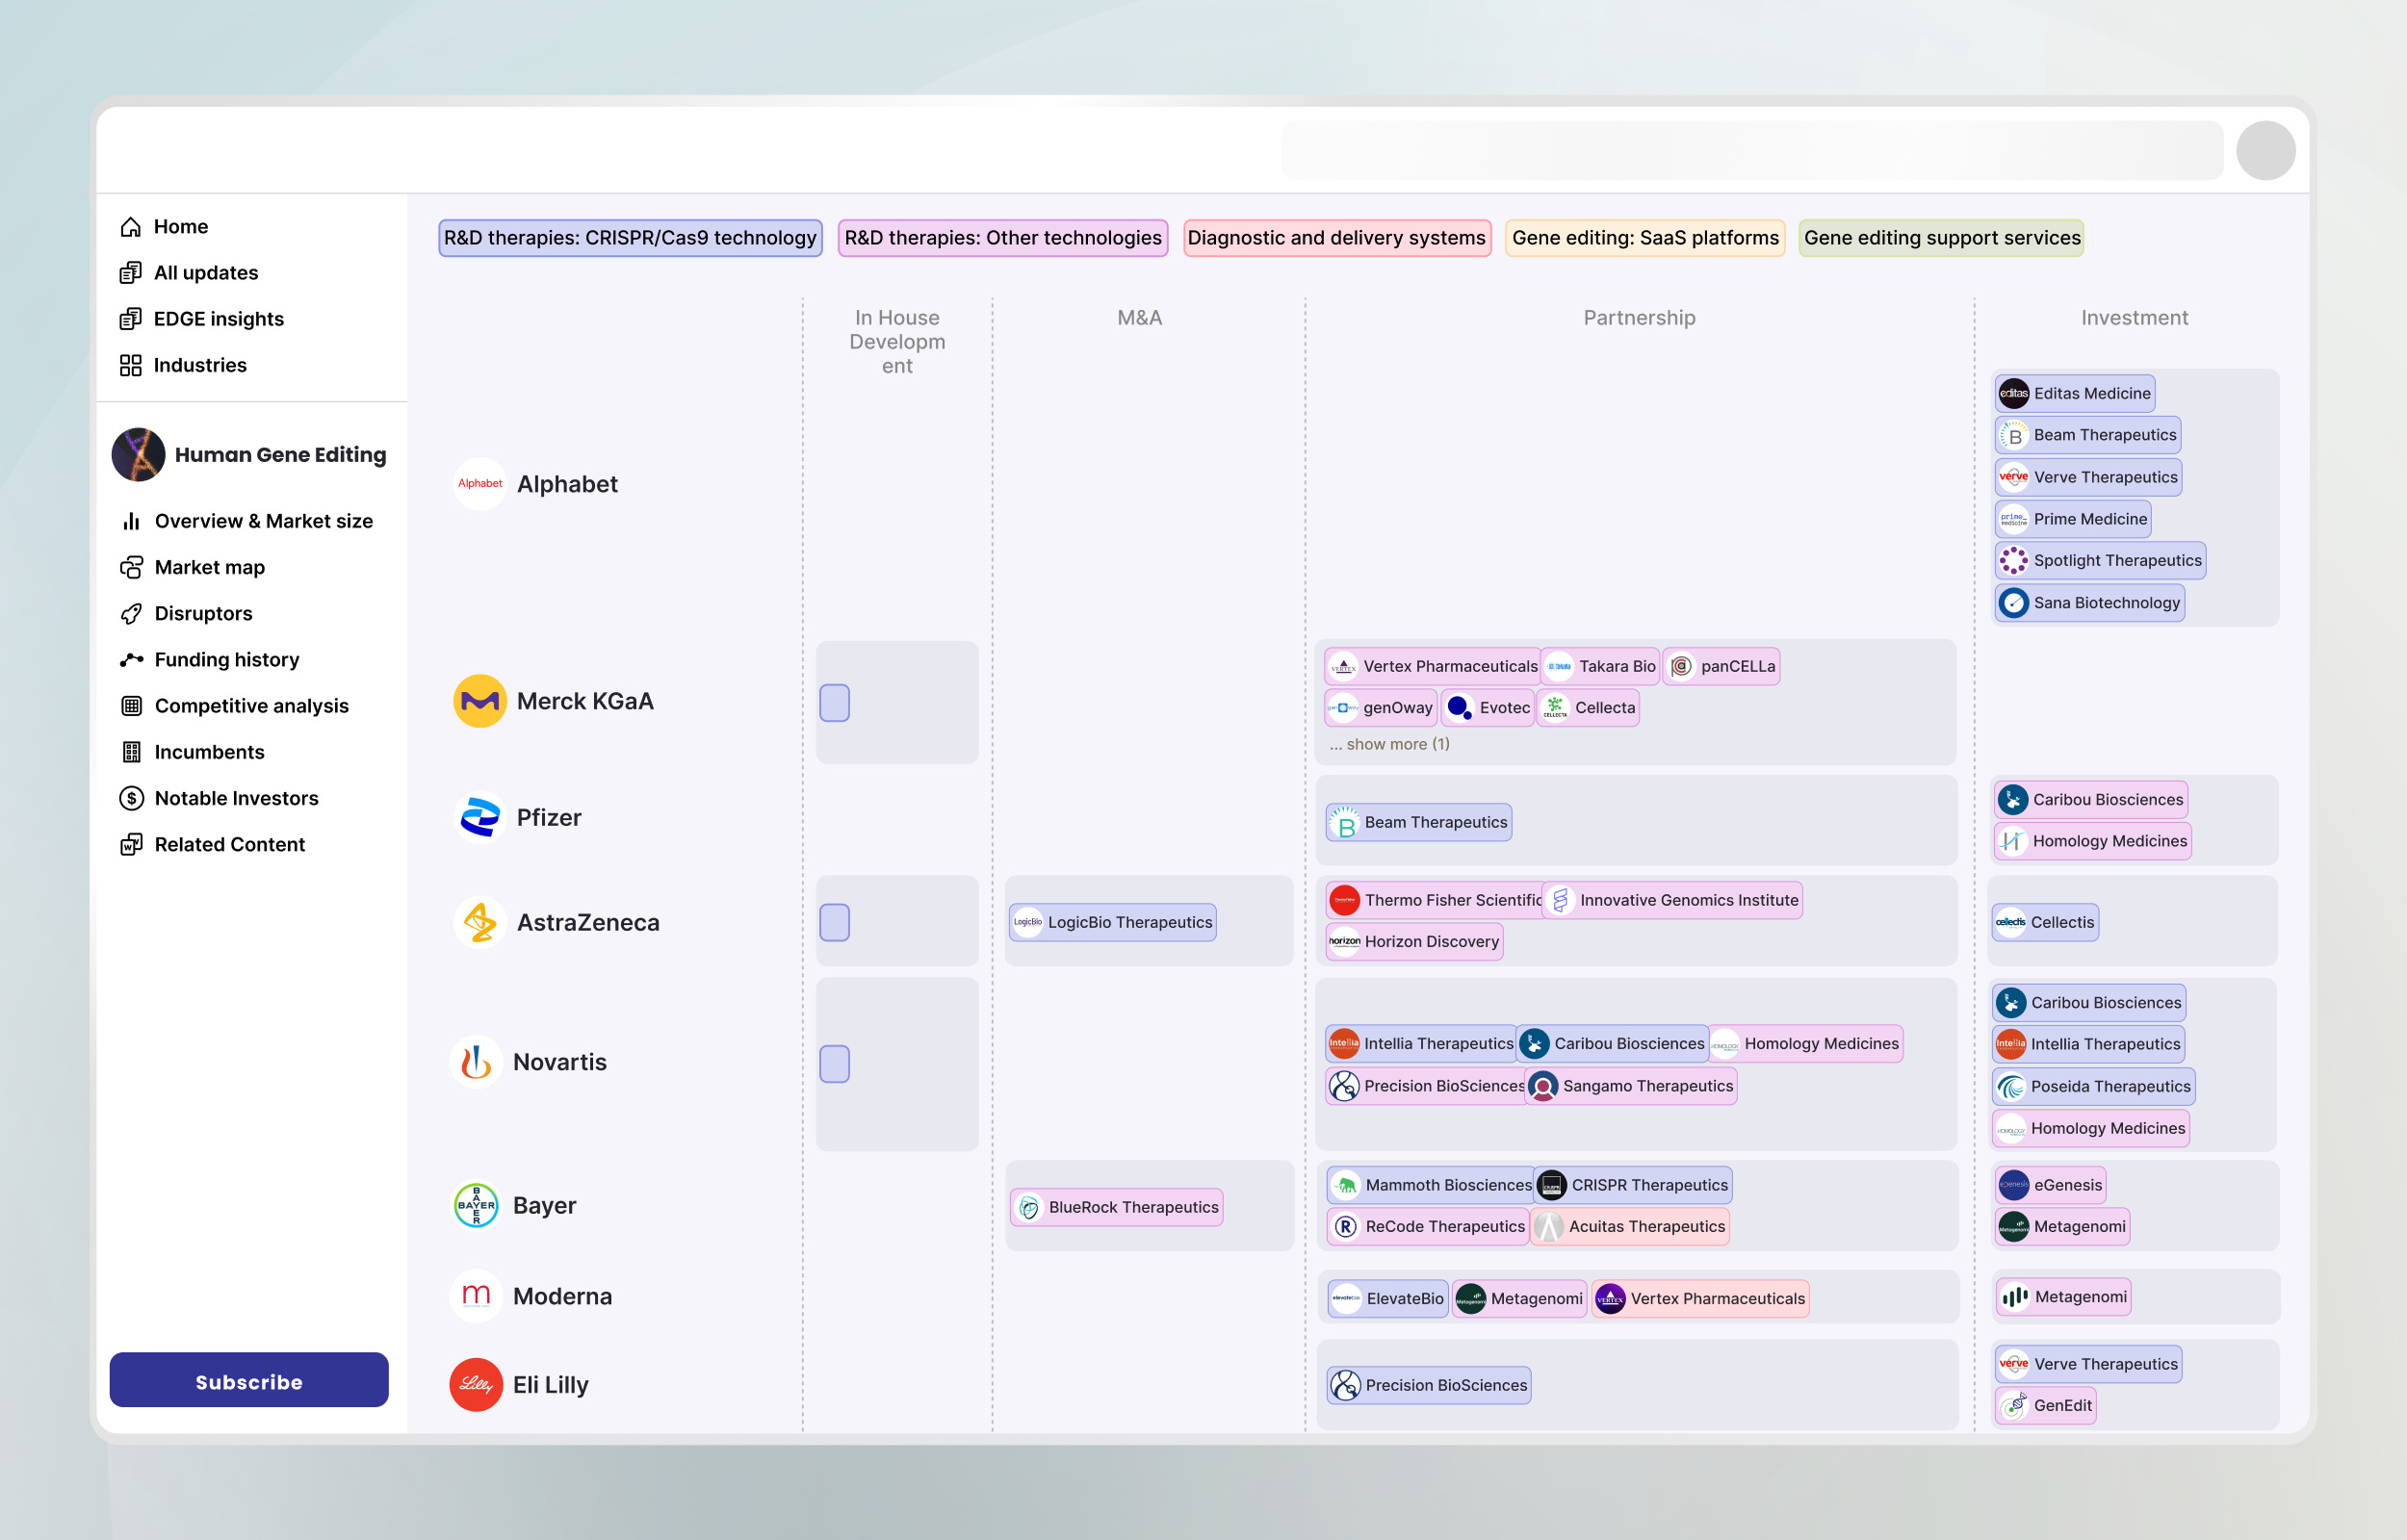
PLEY's dashboard brings customer feedback data to life through real-time visualizations, enabling hospitality businesses to uncover patterns and trends across multiple locations. By aggregating and categorizing data points—such as customer satisfaction scores, response frequencies, and trending concerns—the dashboard displays insights in color-coded charts, line graphs, and heat maps. This approach empowers managers to easily compare performance, identify areas needing attention, and act on customer feedback efficiently. The visual design is tailored for intuitive interaction, featuring customizable filters that adapt to each business's unique metrics, making data analysis accessible and actionable for non-technical users. After wireframing the data to organize it effectively, I created interactive prototypes using Vanilla JavaScript and jQuery libraries to test the dashboard in realistic environments before the engineering team developed the data structure.

2016
PLEY
Customer feedback management system
  • Feedback Trend Tracker: The combination of line charts and bar charts for average customer feedback score by categories at each store location. The system incorporates alerts on declining trends, triggering notifications to regional managers for timely intervention.
  • Store Feedback Ranking: A straightforward yet impactful bar chart that ranks store locations based on feedback. The prototype was created using a blend of vanilla JavaScript and jQuery, allowing for more realistic user experience explorations.
  • Product design for a POC: Developed screen designs for business owners and investors to refine the business strategy.
  • Creating a Coded Prototype: Crafted a prototype using HTML, CSS, and JavaScript (Angular and jQuery) for UX refinements and clearer explanation of the vision.
The use of libraries, such as D3, is helpful for quickly sketching a data visualization to test.

WSJ Market Data

Accordion Arrow

At Dow Jones, I led the design of a customizable market visualization for WSJ's sister app, testing the concept and design before integrating it into the main app.

Get in touch

I'm excited to learn about your project.
Let's collaborate to turn conceptual ideas into concrete results.